What I actually handed it
A single-page PDF from a phone note-taking app: a raster photo of ink on graph paper. A house, the paving strip around it, twenty-two handwritten dimensions in Argentine decimal notation — 8,40 — some rotated ninety degrees to sit alongside vertical lines. No vector data, no layers, no structure.
The question was one number: square metres of flooring to buy.
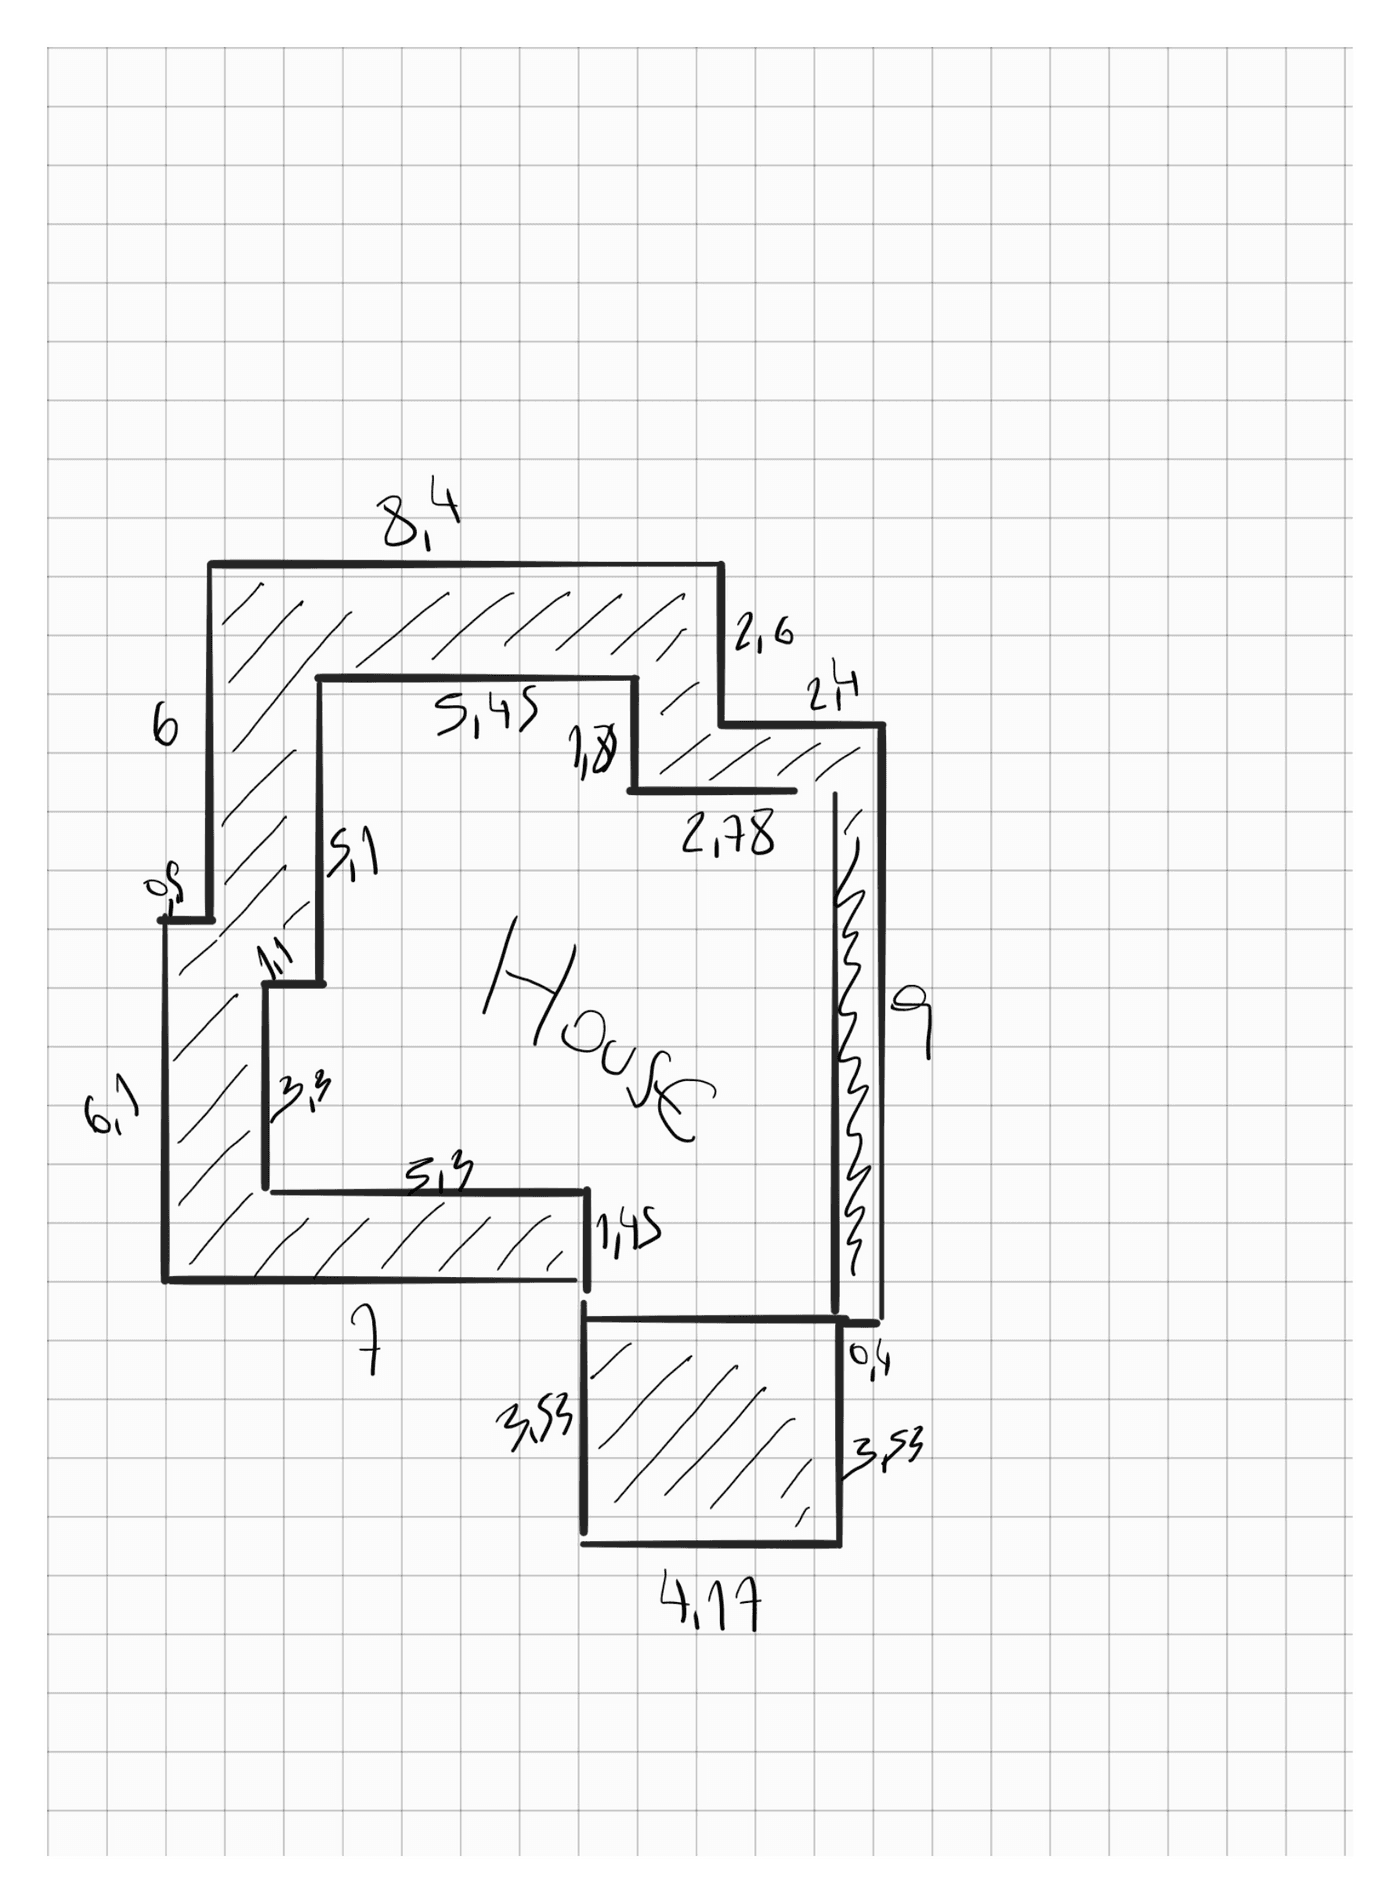
I expected the hard part to be reading the handwriting. It was not. A current model looks at that page and pulls out the numbers and roughly where they sit, and it does it in one shot. Reading was the easy part, and it is the part everyone expects to be hard.
The hard part is that reading produces a belief, and a belief about somebody's handwriting is a poor thing to buy 93 m² of ceramic against. So the first thing I asked for was not the area. It was a way to test the reading.
It turned the sketch into a test
The answer it came back with is obvious in retrospect and had not occurred to me. Any closed outline, walked once, returns to where it started. The edge vectors sum to zero. For an axis-aligned plan the two components separate:
Σ dx = 0 Σ dy = 0Which means a fully dimensioned outline is over-determined. Every horizontal edge appears in one equation, every vertical edge in the other, and nothing about the act of measuring forces either equation to hold. That redundancy is the whole point: it converts did I measure this right from a judgement call into arithmetic.
It wrote the check as a script and ran it against the numbers exactly as written on the sketch:
horizontal   8,40 + 2,40 + 0,80  = 11,60   going right
             0,40 + 4,17 + 7,00  = 11,57   going left      → 3 cm

vertical     2,60 + 9,00 + 3,53  = 15,13   down the right side
             3,53 + 6,10 + 6,00  = 15,63   up the left side  → 50 cm
Three centimetres over eleven metres is tape error. Fifty centimetres is a wrong number.
That is a genuinely different footing than "here is your area, it is about 85 square metres." The system had proved the input was inconsistent before anyone spent money. What it could not do was say which number was lying — and the rest of the session was about that.
Where I was the bottleneck
The arithmetic is trivial. What is not trivial is deciding which segment each handwritten number labels, and that is where I had to keep intervening.
One case carried most of the difficulty. A 1,45 written along a short vertical line near the bottom has two plausible readings:
- (a) the width of the paving strip along the back of the house, or
- (b) the step in the house's own outline at that point.
Both are consistent with where the ink sits. They imply different geometry and about 2 m² of difference. I read it as (a). The owner corrected me to (b).
The useful answer was neither, and it came out of the constraint system rather than out of the drawing: the two segments are the same segment if and only if the patio slab begins flush with the outer edge of the paving — and it does. One label was legitimately doing two jobs, which is exactly why only one number had been written.
That is the pattern worth noticing, and it is why solving constraints beats reading harder. It does not only find errors. It recovers facts about the physical object that nobody wrote down and nobody would have thought to state.
Then it measured the drawing itself
Closure proves an inconsistency exists. Attributing it to a specific number needs evidence from outside the constraint system, and I did not have any — the owner was not going to re-measure all twenty-two.
Its idea was to use the scan as evidence, on the grounds that a sketch drawn on graph paper is roughly to scale even when it is not accurate. This is the move I would not have made, and it is the most interesting thing in the whole exercise:
- Rasterise the page at a known resolution —
pdftoppm -r 200 -png -gray. - Threshold. Pen strokes are much darker than the printed grid, so a cut at
pixel < 110isolates the drawing. - Sum the boolean mask along each axis. A long straight stroke spikes the column sum (vertical lines) or the row sum (horizontal ones). Runs above a threshold are the drawn lines; the argmax within each run is its position in pixels.
- Fix the scale with one dimension you trust. The
8,40top edge spans 650 px → 77.4 px/m. - Convert every detected line position to metres and compare each segment against its handwritten label.
Every segment agreed with its label to within 0.3 m — except one. The long right-hand vertical labelled 9,00 measured about 9.8 m at the drawing's own scale.
It was careful to say what that is and is not. Hand drawings distort, and this one distorts most where the gaps are narrow, so it is not proof. But combined with a 50 cm closure failure it points at one number instead of five. That is the difference between re-measure the right-hand side, it is worth 2 m² and are you sure about these numbers — and it is the difference between the owner walking outside once and not bothering.
Worth stating the precondition, because it bounds the trick: this only works because the sketch was drawn on graph paper with honest proportions. A deliberately schematic drawing yields nothing.
The round where it contradicted itself
| Round | Left chain | Right chain | Vertical residual |
|---|---|---|---|
| As written | 6,00 + 6,10 = 12,10 | 2,60 + 9,00 = 11,60 | 50 cm — right side short |
| Label reassigned | 6,00 + 6,10 = 12,10 | 2,60 + 9,00 = 11,60 | 50 cm — proposal: 9,50 |
| Left re-measured | 5,80 + 5,50 = 11,30 | 2,60 + 9,00 = 11,60 | 30 cm — right side long, proposal: 8,70 |
| Left re-measured again | 5,90 + 5,68 = 11,58 | 2,60 + 9,00 = 11,60 | 2 cm — closes |
Round three is the instructive event, and it is the part I would want anyone doing this to see. Under the first hypothesis the correction to 9,00 was upward, to 9,50. Under the second it was downward, to 8,70. Both were derived correctly from the data available at the time. They contradict each other.
A residual tells you the magnitude of an inconsistency, not its cause. Attribution is a separate problem and it is only settled by more measurements. An agent that reports the proposed correction without reporting that it is one of several possible attributions is producing a number that looks firmer than it is — and I had to ask for that framing explicitly before I got it. It is the thing I would push hardest on if I ran this again.
Re-running closure after each correction cost nothing, which is the only reason four rounds was practical rather than tedious. That is the real argument for making the check a program instead of a reading.
What fell out that nobody measured
Once the outline closes, the rest of the geometry is determined. None of the strip widths were ever measured; they are consequences:
| metres | |
|---|---|
| Strip along the front | 1,73 |
| Left side, upper run | 2,03 |
| Left side, lower run | 1,73 |
| Strip along the back | 1,45 |
| Strip along the right | 0,54 |
So is the house's right-hand wall at 8,05 m, which carries no dimension anywhere on the sketch.
The internal coherence of that set is itself a check, and it flagged this without being asked. Four of the five widths land between 1.45 and 2.03 m, which is what a person laying a footpath actually produces. Had one come out at 0.2 and another at 3.4, the topology would have been wrong somewhere and the closure would have been a coincidence.
The right-hand strip is the exception and it is instructive too: 0.54 m by closure against 0,40 written on the sketch. That 14 cm is precisely the residual of the house's own perimeter loop — 5,45 + 2,78 = 8,23 against 4,17 + 5,30 − 1,10 = 8,37. Accumulated tape error has to land somewhere, and it lands in the narrowest dimension, because that is where a fixed absolute error is least visible.
Drawing and number from one source
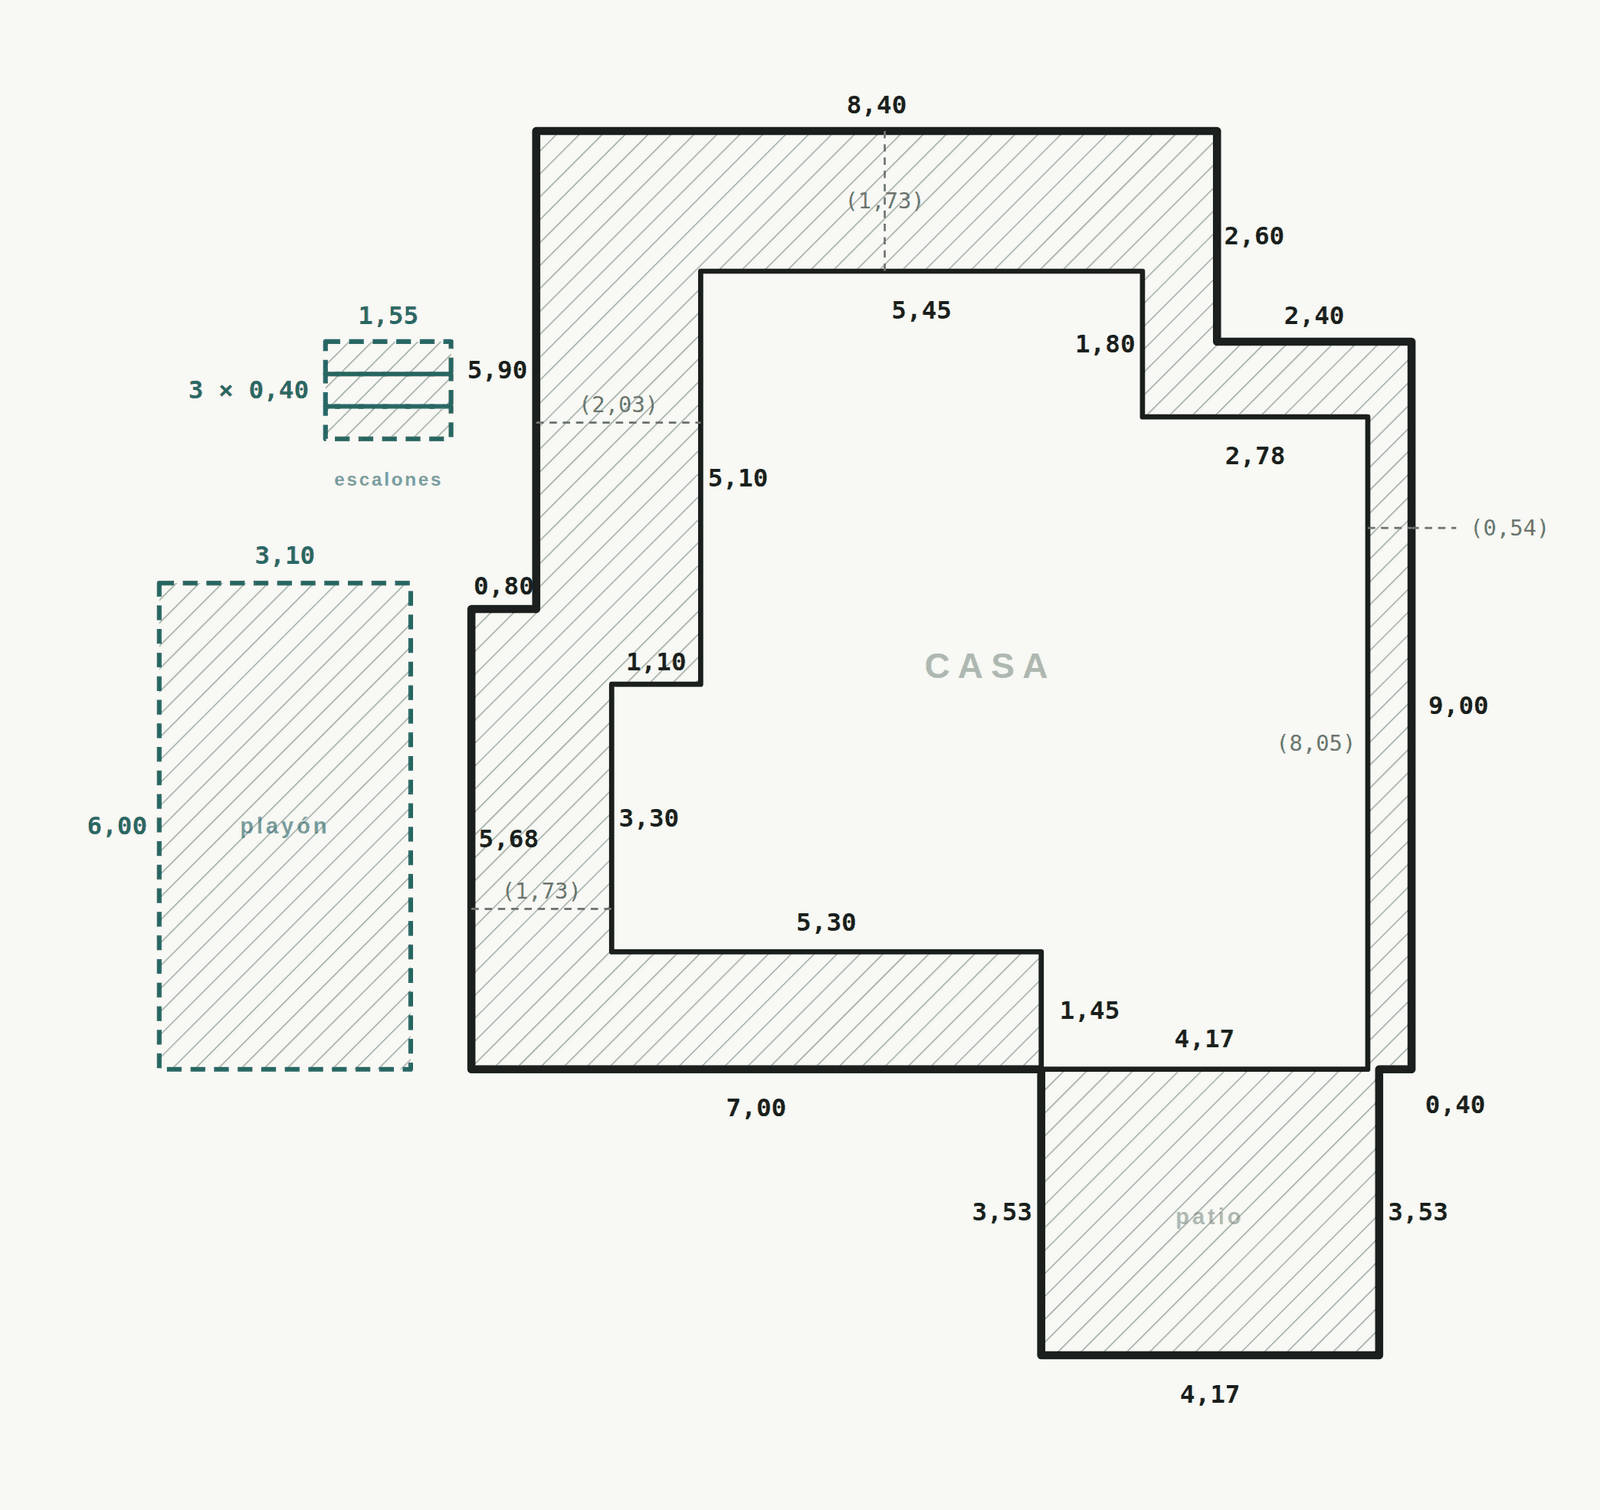
The clean plan is generated, not drawn: two arrays of vertices, one for the outer boundary and one for the house, converted to SVG paths in a loop. Dimension text sits at each segment's midpoint with a per-segment offset, which is the only part needing manual fiddling — labels collide, and where they collide is not predictable from the geometry.
The paved region is a single path using both polygons with fill-rule="evenodd", so the house is a hole rather than something subtracted by decomposing the strip into rectangles. That matters more than it sounds: rectangle decomposition is where hand calculations of this kind normally go wrong.
The area comes from the shoelace formula over the same arrays:
A = ½ |Σ (xᵢ · yᵢ₊₁ − xᵢ₊₁ · yᵢ)|

outer   138,09 m²
house    73,60 m²
paved    64,49 m²
Plus a detached car pad and three steps measured separately: 84.95 m² net, 93.4 m² with 10 % cutting waste.
Because the drawing and the area come from the same arrays, they cannot disagree. The usual failure in this kind of work is a plan that says one thing and a spreadsheet that says another; deriving both from one source removes that class of error entirely.
The verification tool that lied
One detour worth a paragraph, because it nearly cost an afternoon. Generated SVG has to be looked at, and an agent cannot look at a file — it has to render it to a raster and read that back.
ImageMagick's convert was on the machine and rendered the SVG wrongly: bad font metrics, mishandled viewBox, output that looked like a serious bug in the generator. It was not. Headless Chrome rendered the same file correctly:
google-chrome --headless --disable-gpu --screenshot=out.png \
  --window-size=1240,1150 --hide-scrollbars "file://$PWD/plan.html"
Two label collisions were found and fixed this way that were invisible in the source. The broader point: a verification tool that silently disagrees with the target renderer is worse than no verification at all, and the only way to find that out is to check its output against something you already know is right.
What it could not do
Every genuinely new fact here came from the person holding the tape. The agent could show that a number was wrong, rank which one, and state what the answer must be if everything else is right. It could not:
- know that the car pad sits at the entrance to the lot rather than against the house — the difference between 85 and 75 m²;
- know whether the risers of the steps get tiled as well as the treads;
- decide whether
0,40or 0,54 is the true width of the right-hand strip.
The division of labour is the same one I keep running into: the agent holds the model and the arithmetic, the human holds the ground truth. What changes is the quality of the questions. Because the constraint system identifies which measurement is load-bearing, the ask becomes re-measure the right-hand side, it is worth 2 m² rather than are you sure about these numbers. That is a question somebody will actually go and answer.
What generalises
- Any measured artefact with redundancy can be checked mechanically. Floor plans close. So do bills of materials, timing budgets, and financial models. The redundancy is usually already there and simply not exercised.
- Ask for the test before the answer. I did not ask "what is the area." I asked how we would know the numbers were wrong. Everything useful came out of that ordering.
- Independent estimates make attribution possible. Closure finds the error; measuring the scan points at the culprit. Neither alone gets there.
- Make it report the ambiguity, not just the correction. Round three would have been an expensive mistake if I had acted on round two.
- Drawing and number must come from one source of truth, or they will eventually disagree and nobody will notice.
Total elapsed time was under an hour, most of it the owner walking outside with a tape measure. That ratio is the actual result.